

Scan the full year
Keep every month visible in one Captured Leads chart.
Lead AnalyticsMonthly leads
Compare captured leads across all twelve months.
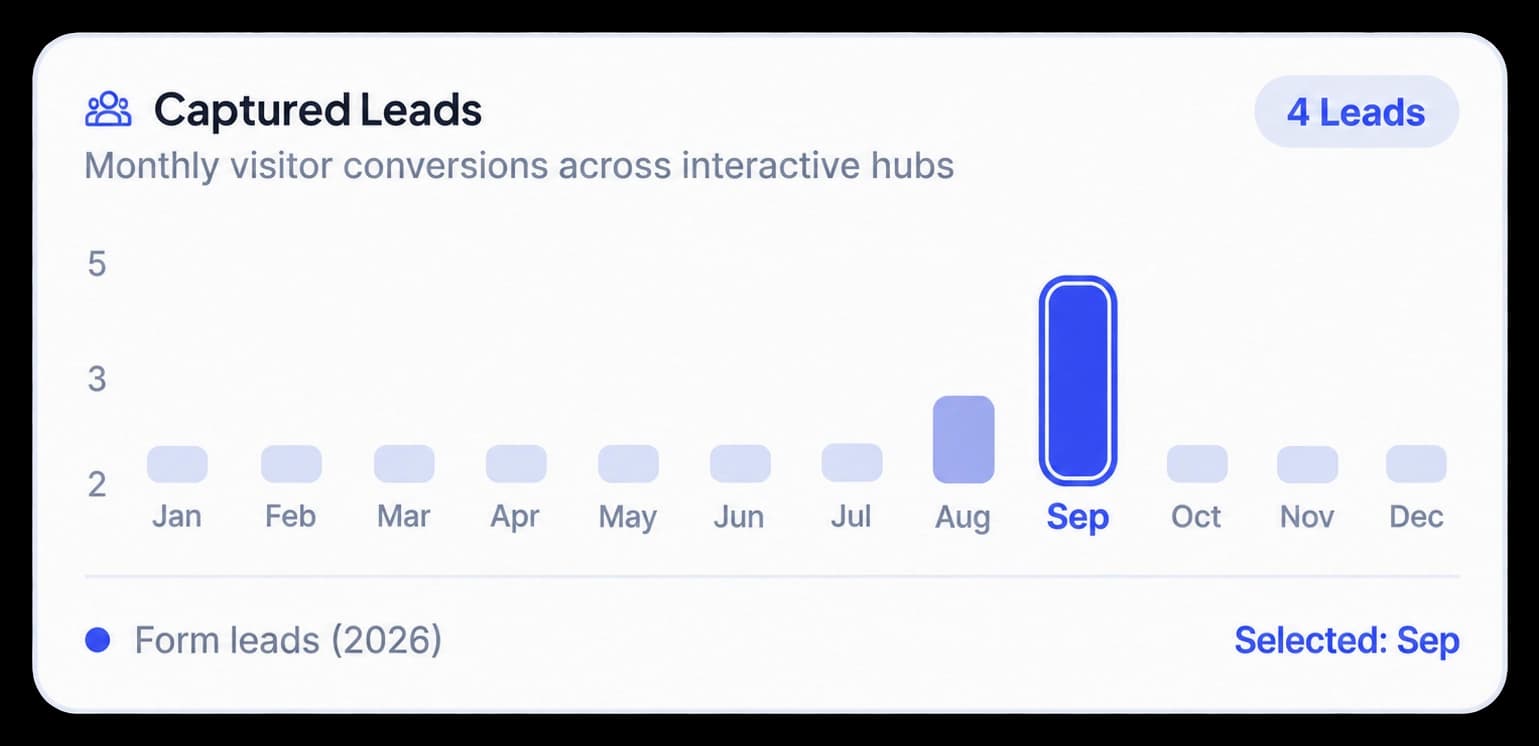
See the year in one chart
The dashboard’s Captured Leads chart plots monthly visitor conversions across interactive hubs. Select a month to review its count, then compare the pattern across the year.
Keep every month visible in one Captured Leads chart.
Select a bar to highlight the month you are reviewing.
Use the selected month and lead total to understand the chart.
In the dashboard
The chart keeps all twelve month labels in view and highlights the selected month. In the supplied dashboard example, September is selected with four leads and August has one.
Inside the workflow
Read the year across the chart, select a month, and compare its lead count with nearby months.
Find the monthly chart in the Statistic panel.
Choose the month you want to examine on the chart.
Review the selected count against the rest of the year.
Product video
Record the control, the change it makes, and the result on screen.
annual-lead-generation-chart.mp4Where it helps
A month-by-month view helps teams review when form submissions arrived during the year.
Product marketing
Workspace owners
Sales teams
A few useful details
Captured Leads shows monthly visitor conversions across interactive hubs.
Yes. Selecting a bar highlights the month and its lead count.
No. The screenshot’s four September leads and one August lead are example workspace data; your chart reflects your workspace.

Build interactive walkthroughs, personalize prospect links, and export 60 FPS motion videos without writing code or waiting on engineering.